|
Research Blog
My research interests include high-resolution monitoring and modeling techniques to better understand groundwater flow in spatially and temporally complex geologic systems. Methods include geochemical sampling of groundwater after recharge events, fracture flow modeling, and the use of thermal imagery from drones. My study sites have included areas in Minnesota, Missouri, Pennsylvania, Florida, and now western Montana. |
|
I will be chairing a session on advancements in groundwater modeling at the GSA Connects 2022 meeting in Denver, CO. Time to spread the word!
0 Comments
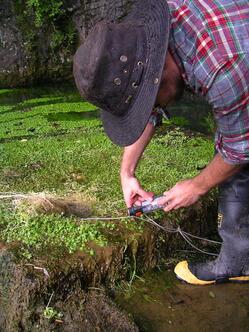
As one of the final fieldwork activities in the Flathead Valley we are conducting some drilling to better understand some of the local hydrostratigraphy. Specifically, emplyoying rotosonic drilling. 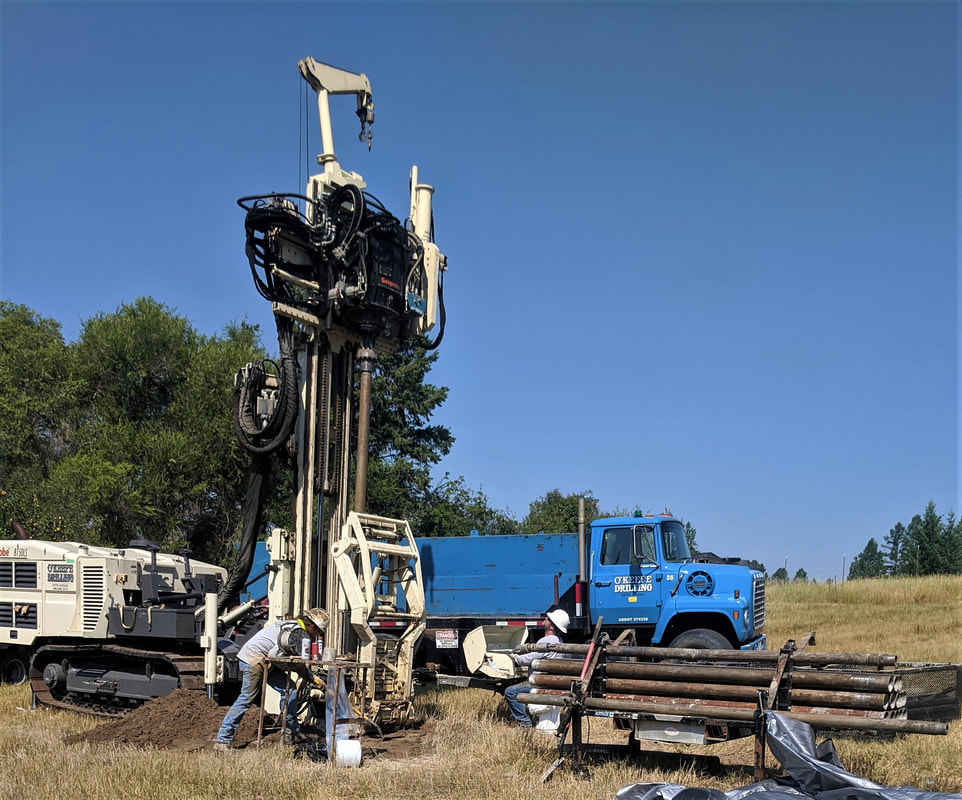 Rotosonic drill operating at one of our field sites. This particular type of drilling is useful in soft sediments as it preserves the fine sedimentary structures and layering that is often destroyed during other more common drilling methods. It also allows us to identify stratigraphic contacts at a higher degree of fidelity. 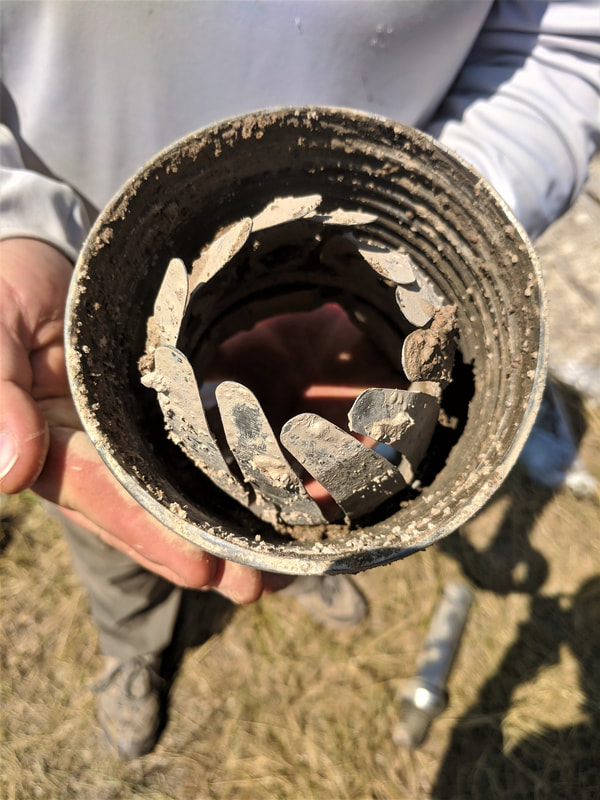 These inward-collapsing teeth in the drive shoe prevent sediment from sliding back down the drill core as it's hoisted to the surface. 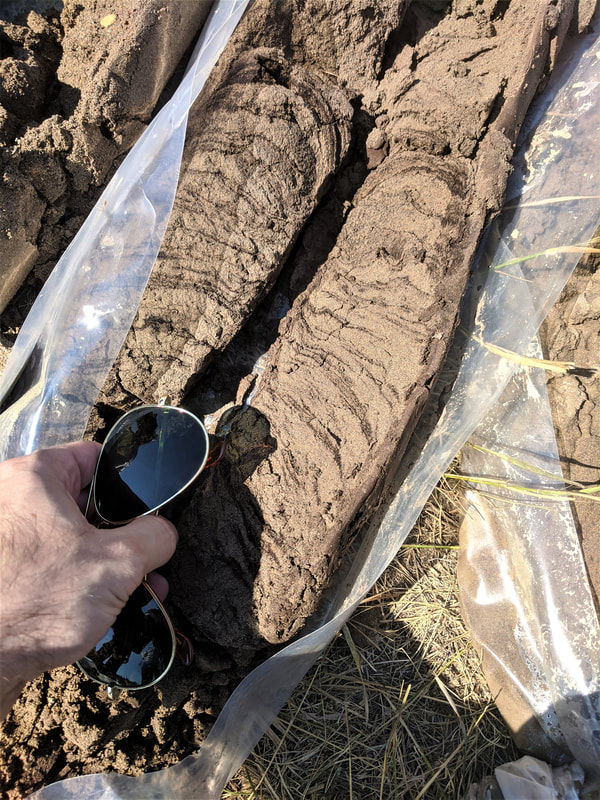 A section of sediment core laid out in one of the long sample bags. Note how the fine layering has been preserved, although it does become slightly warped along the edges due to the vibrating tube. 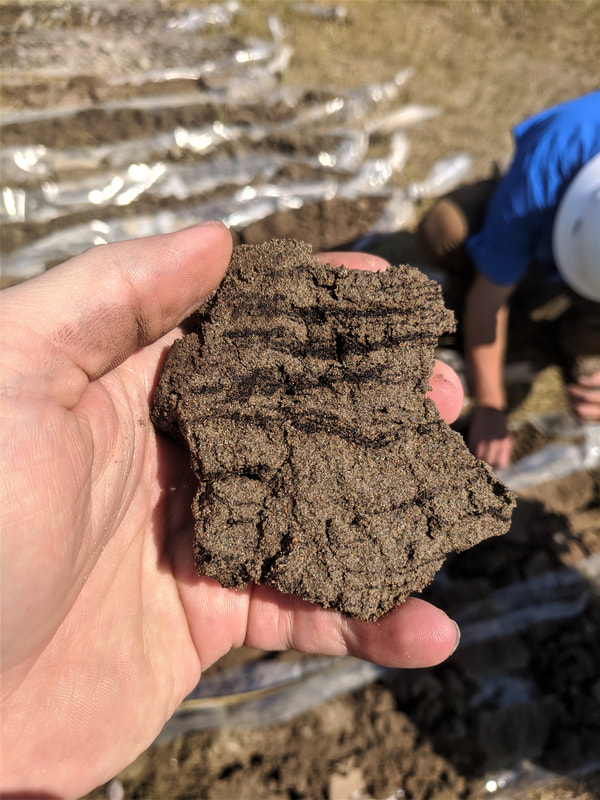 Hand sample of some fairly coarse sand, very crumbly when dry. 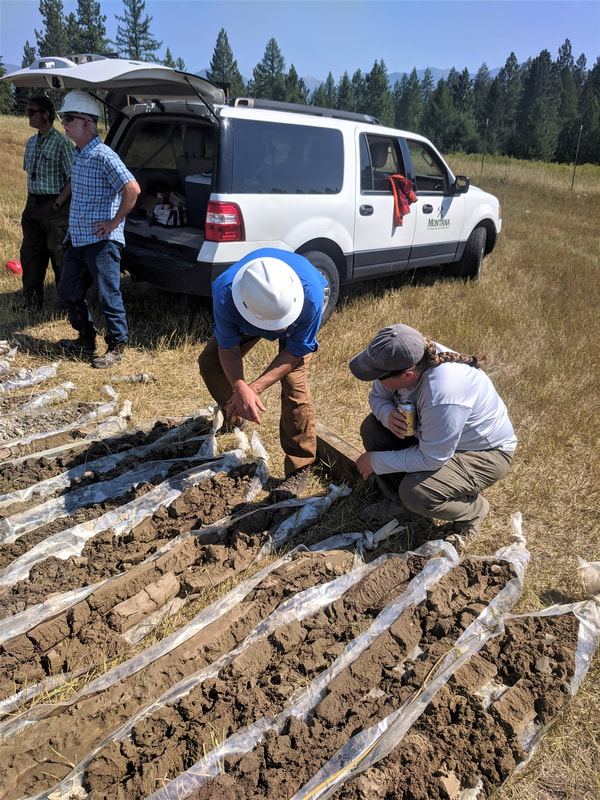 Some of our drill core and sedimentary experts taking notes and discussing what they see in the sediments. This site in particular was almost entirely sand and gravel from the surface down to 300 feet. With this information we'll be able to construct an improved conceptual model of local stratigraphy for our groundwater model, in particular the presence or absence of confining layers. 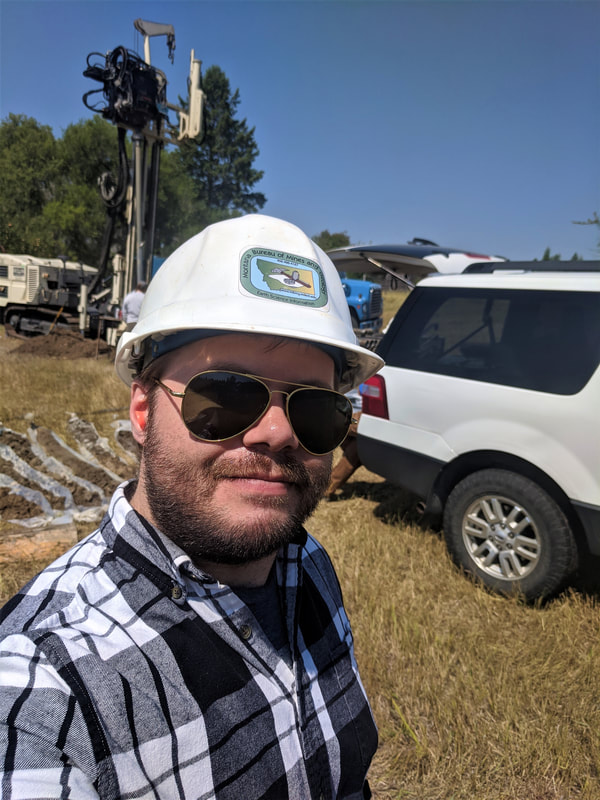 Time for a fieldwork selfie (you know the drill...). As a follow-up to the well drilling the other month and the last phase of data collection, we spent the week in the Flathead Valley installing data data loggers in wells. 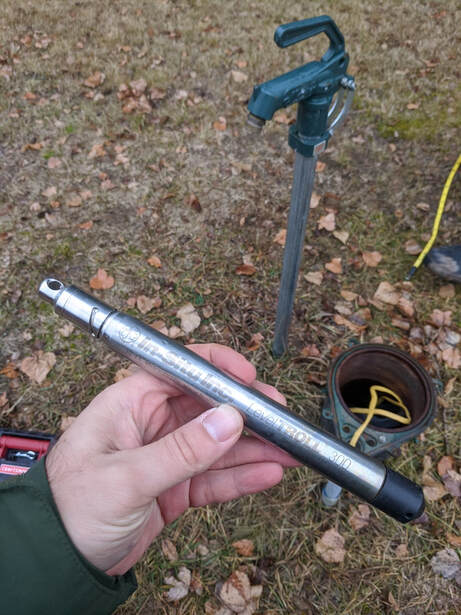 One of the data loggers, programmed and ready to go! The last year and a half of manual water level checks once a month revealed some interesting patterns about seasonal water use stresses and recharge timing and intensity to the different aquifer layers within the Valley. 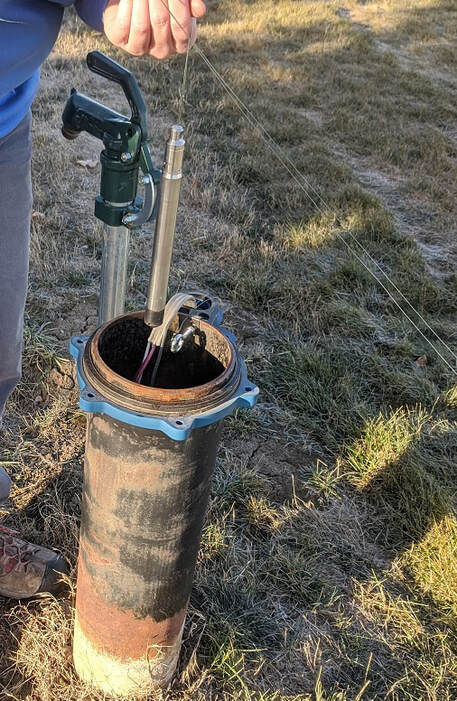 Installing a data logger in a domestic well. The wells we installed loggers in ranged from shallow to deep, and from in-use (such as the well above, as apparent by all the pump cables) to un-used, such as the wells we recently drilled that have not have pumps installed. These sites with multiple wells in close proximity but at different depths will be especially insightful on how the aquifer system behaves. 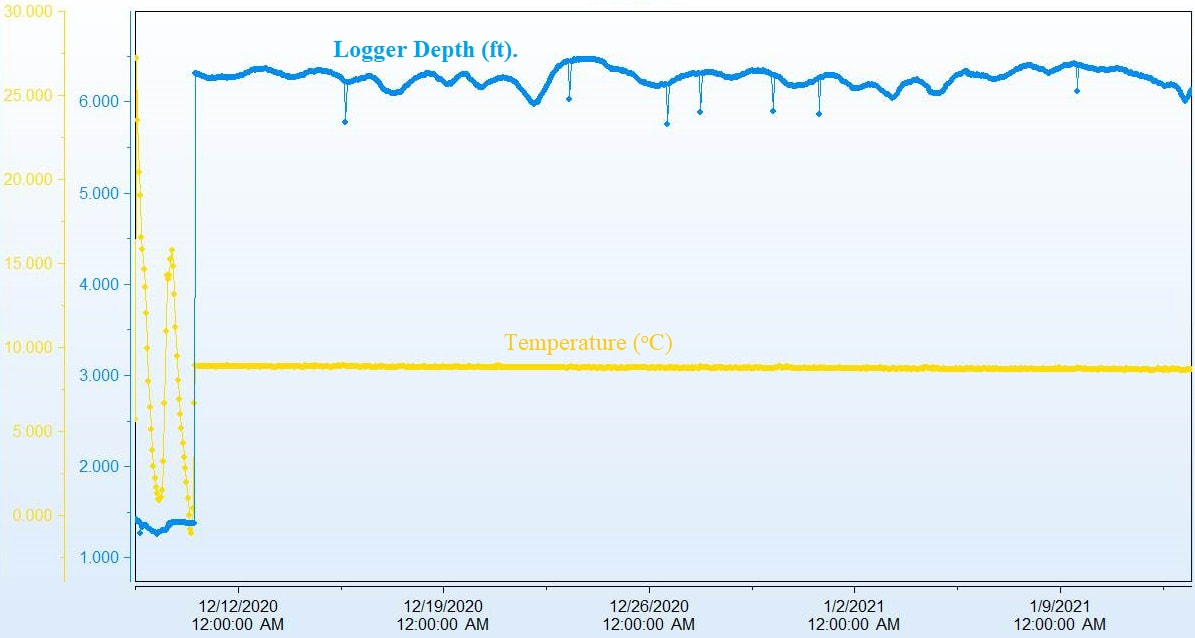 Raw plot from one of the data loggers showing logger depth below water (which will be translated to well water level) and water temperature. Odd values at the start of the plot were after the logger was activated but before installed in the well. Blips in the water level data throughout were when the logger took a point while the well was in use. With the loggers we collect high-resolution water level data in the wells, along with temperature, such as the plot above. Some loggers were installed a little earlier, such as this one, and checked during the field run to ensure they were functioning properly. As there is very little meltwater recharge or heavy pumping use during this time of year, most wells are holding steady water levels (the fluctuation in the plot above is likely due to air pressure changes, which haven't been corrected for yet). As the spring snowmelt runoff begins around April and irrigation pumping begins around July, we expect to see quite a bit of variation, with some well levels rising or falling as much as 20 feet. Needless to say, it will be quite a lot of useful data! 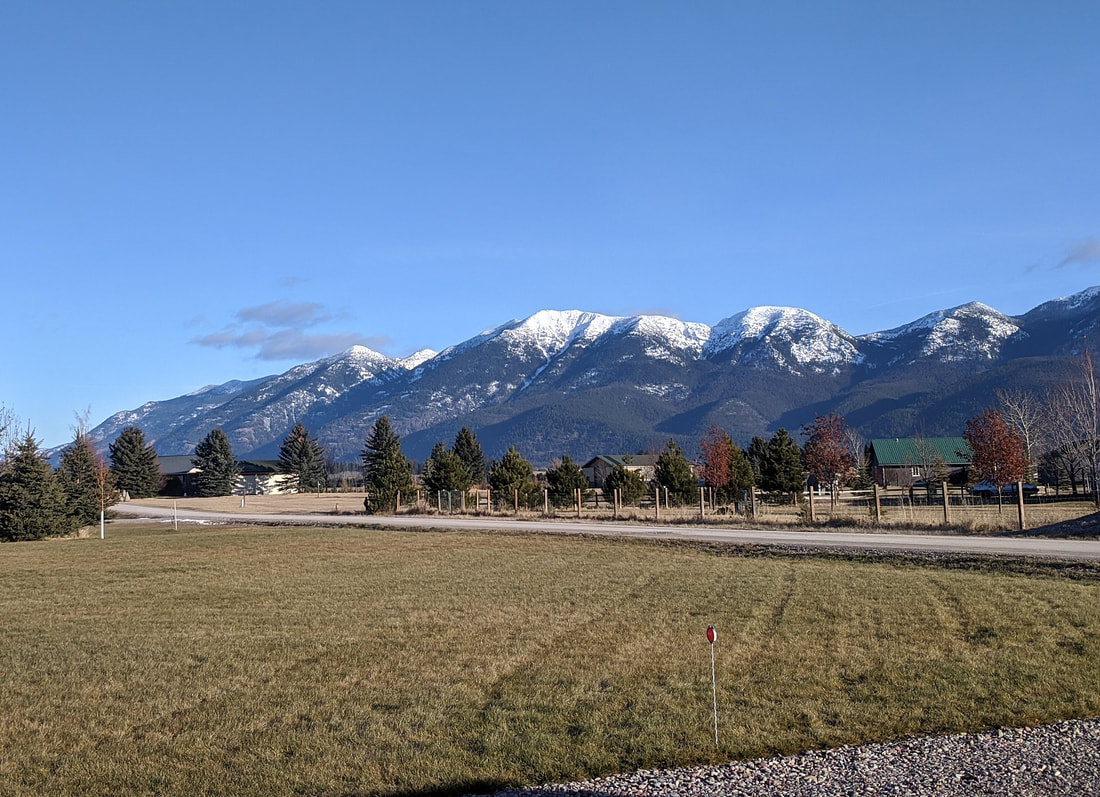 While weather down in the Valley is pleasant and dry, snow pack continues to accumulate on the Swan Range east of Kalispell, which will be our seasonal meltwater recharge. For most of the month we will be up in the Flathead Valley drilling a series of exploratory ground water wells. Due to the lack of wells or deep wells in certain parts of the study area there are gaps in our knowledge regarding the connectivity between shallow and deeper sand and gravel layers. 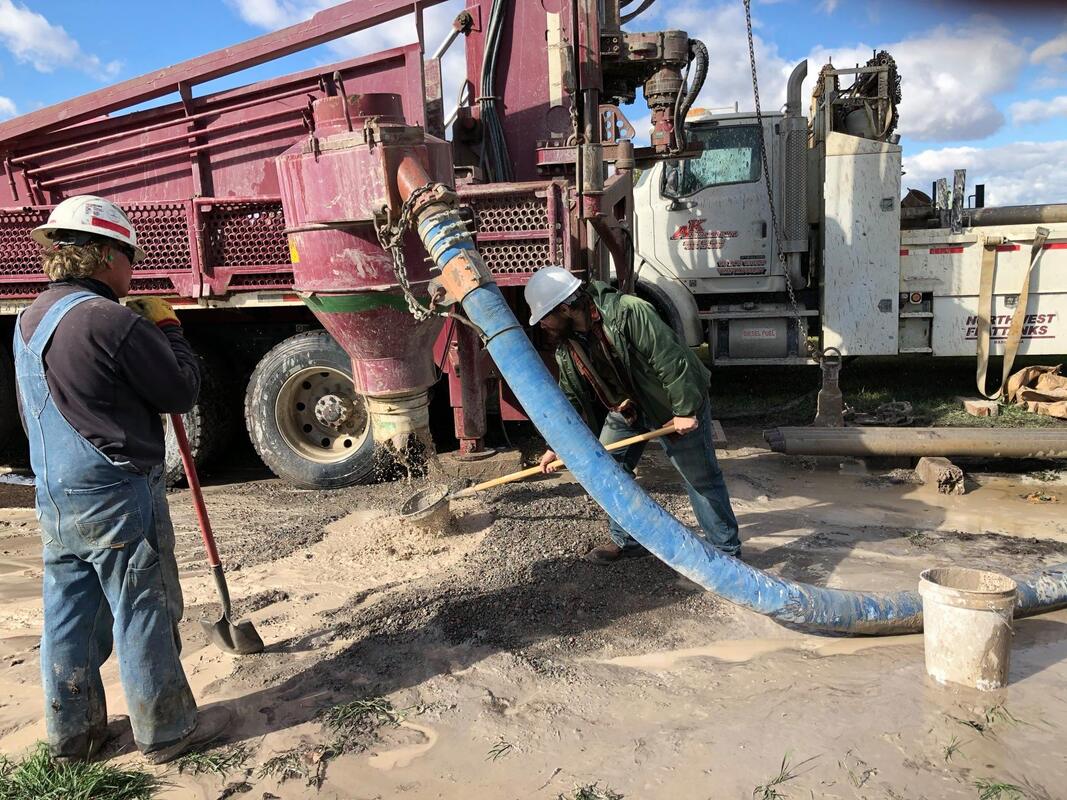 Sampling the coarser materials at this particular depth. 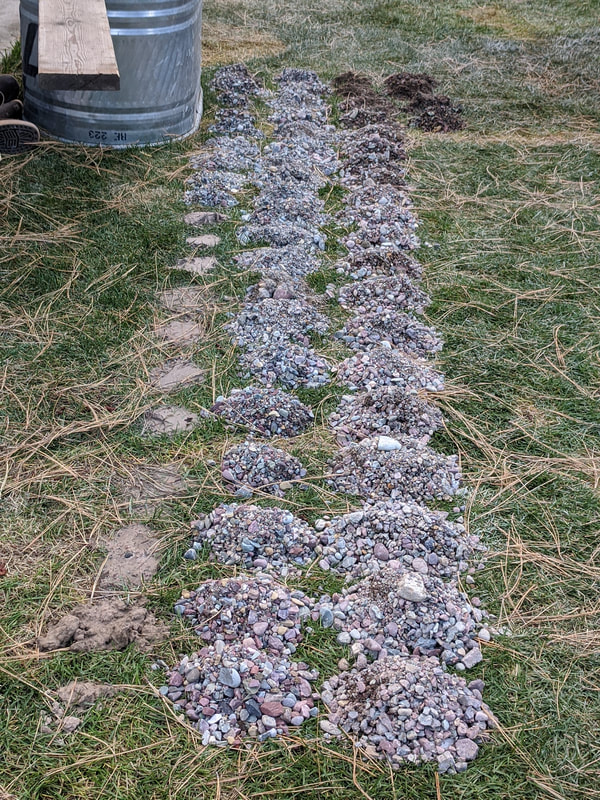 Laying the samples out on the grass as we drill to get a visual idea of what changes are occurring at depth. While drilling the wells we will be on site taking a detailed look at the lithology changes at depth within these glacial and lacustrine sediments. We will also monitor water levels in these new wells, along with sampling water chemistry, to compare with their shallow well counterparts. These sites are all on private land, mostly those of land owners who have been part of our longer-term ground water study and who were interested in having a new, deeper well drilled on their property. We hope these wells work out for them! 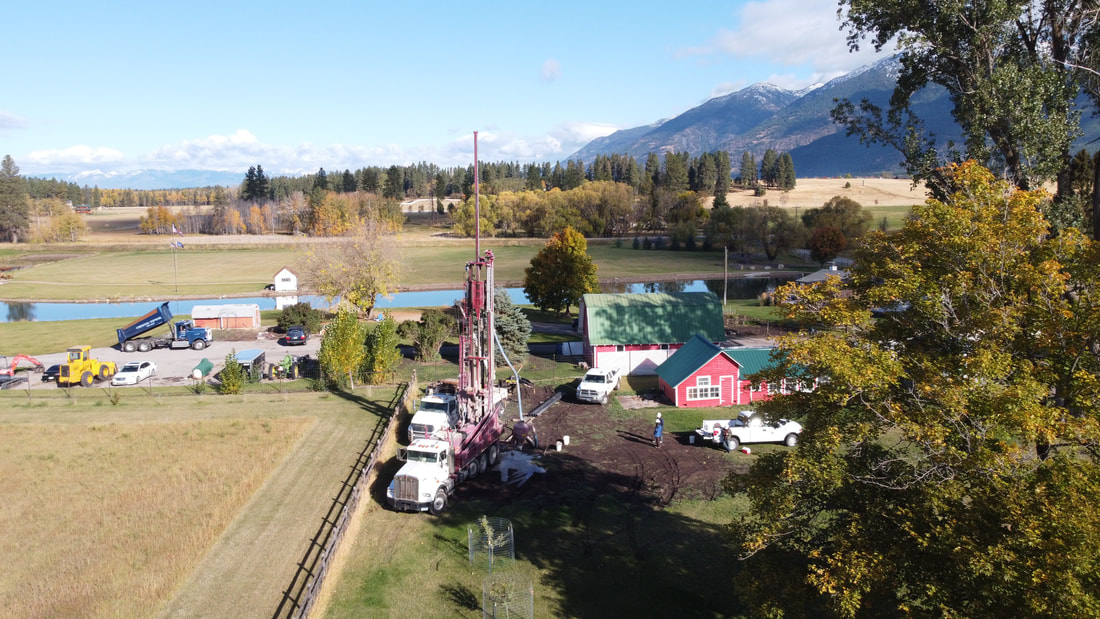 Brought the drone! As part of the ongoing research project I'm part of to study the hydrogeology of the Flathead Valley, Montana, we conducted a series of geophysical surveys using Time-Domain Electromagnetics (TEM) and Magneto-Tellurics (MT). The TEM surveys consist of laying out a large loop of wire (~100 m in diameter for our case) which is then hooked to a power source that produces varying electrical pulses through the wire, inducing a large magnetic field which penetrates the subsurface. A receiver at the center of the loop of wire measures the varying magnetic field, which decays in specific ways depending on the electrical conductance of the material below, such as sand (low conductance) vs. clay (high conductance). 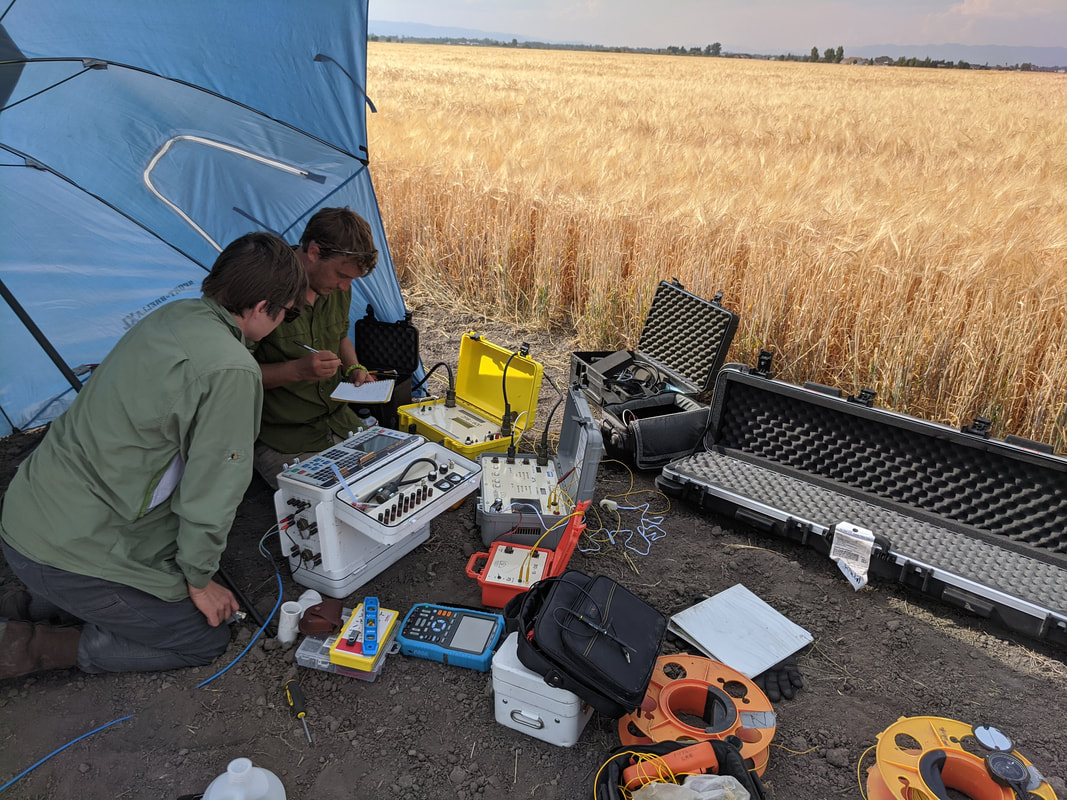 Geophysics faculty Trevor Irons and new graduate student Liz Breitmeyer running the TEM equipment near Flathead Lake. 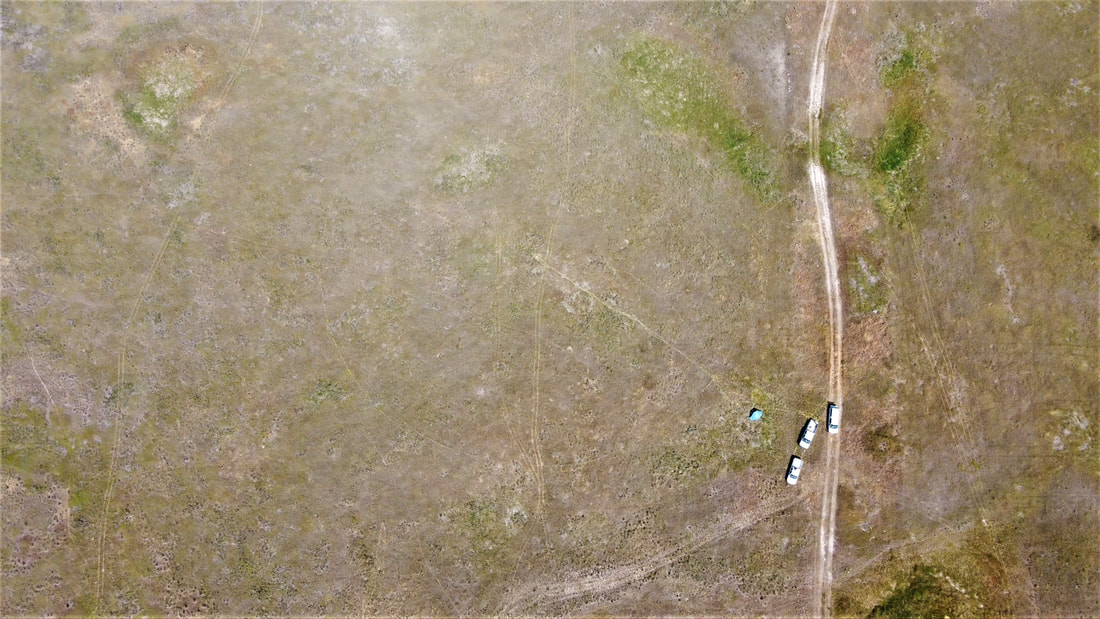 Aerial view of drone setup - foot tracks roughly outline location of wire loop and center receiver. Magne-Tellurics (MT) involves installing a trio of XYZ oriented coils and a pair of electrodes to measure fluctuations in the earth's geomagnetic and geoelectric fields. These variations result from solar radiation and lighting strikes all across the planet, with variations resulting from the different electrical conductance of geologic materials below. This method is used to image much deeper than TEM, although both methods complement each other well. 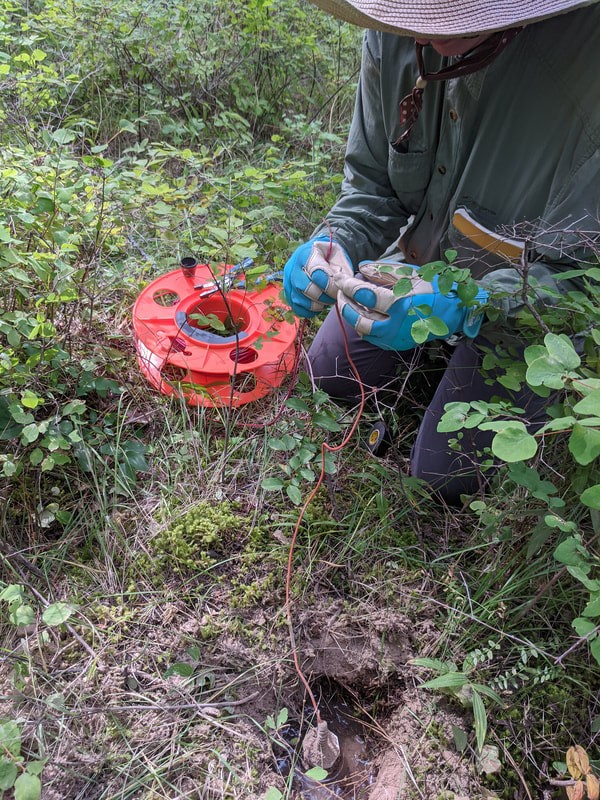 Liz burying and wiring up an electrode. 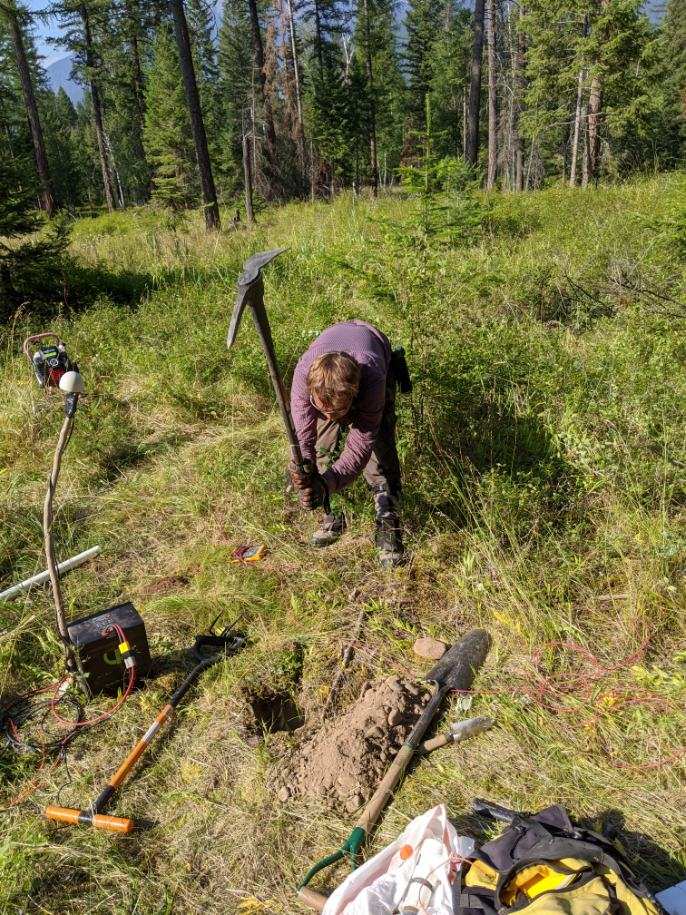 Trevor digging a hole for an MT coil. 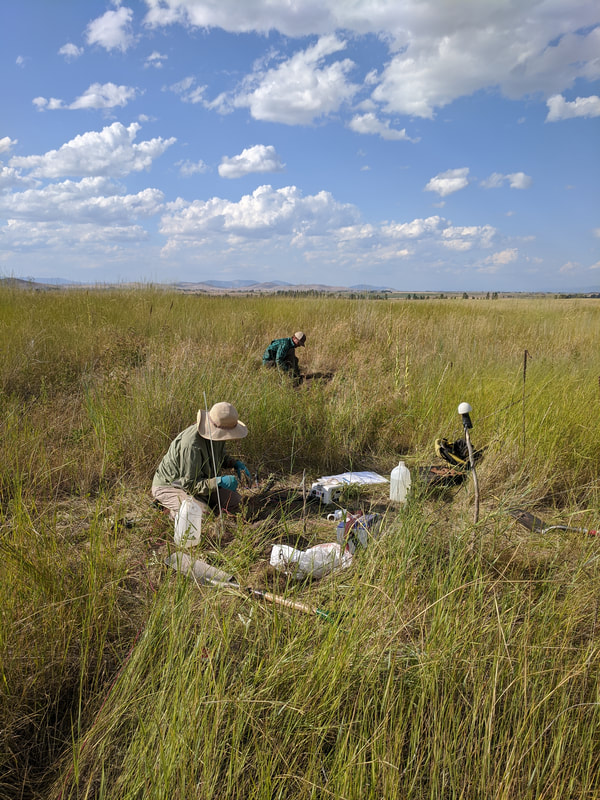 Liz and Trevor wrapping up an MT site. This nearly two week stretch of fieldwork was quite a bit of work, especially since it was in the 90s and mostly sunny every day! With these results we hope to better understand the stratigraphy of certain parts of the Valley, in particular the presence of a confining layer and the deeper, poorly understood Tertiary sediment layer. Hopefully the data yields some interesting results that will help us with constructing our groundwater model of the Valley and lead to some conference talks, research collaborations, and hopefully a publication! 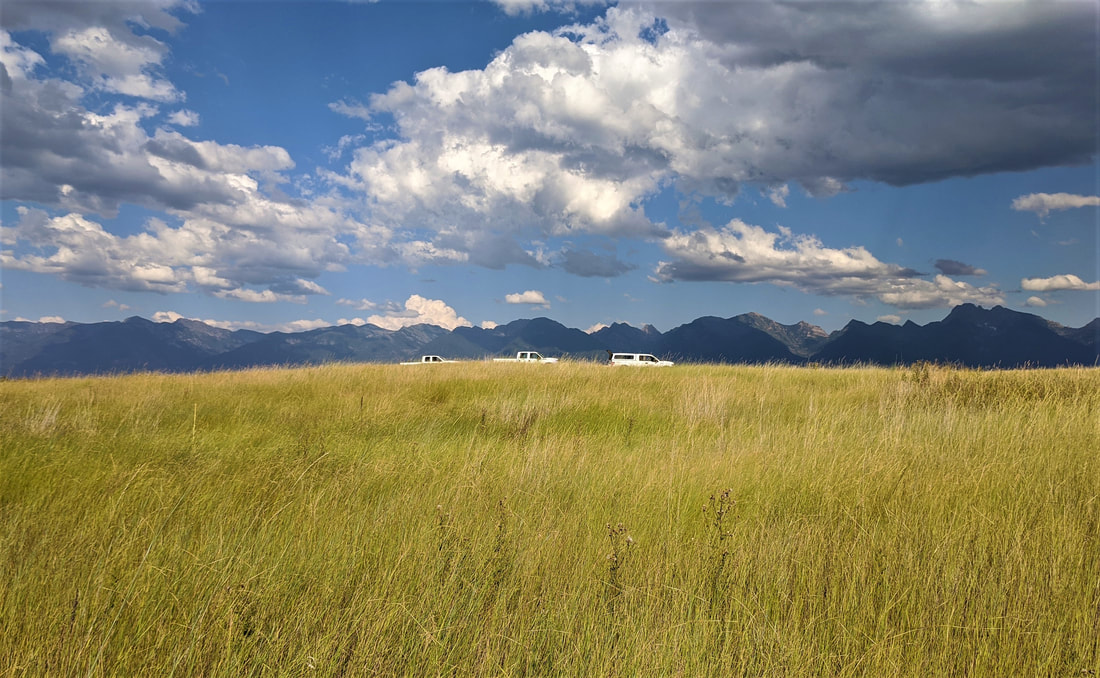 Field vehicles, all in a row. 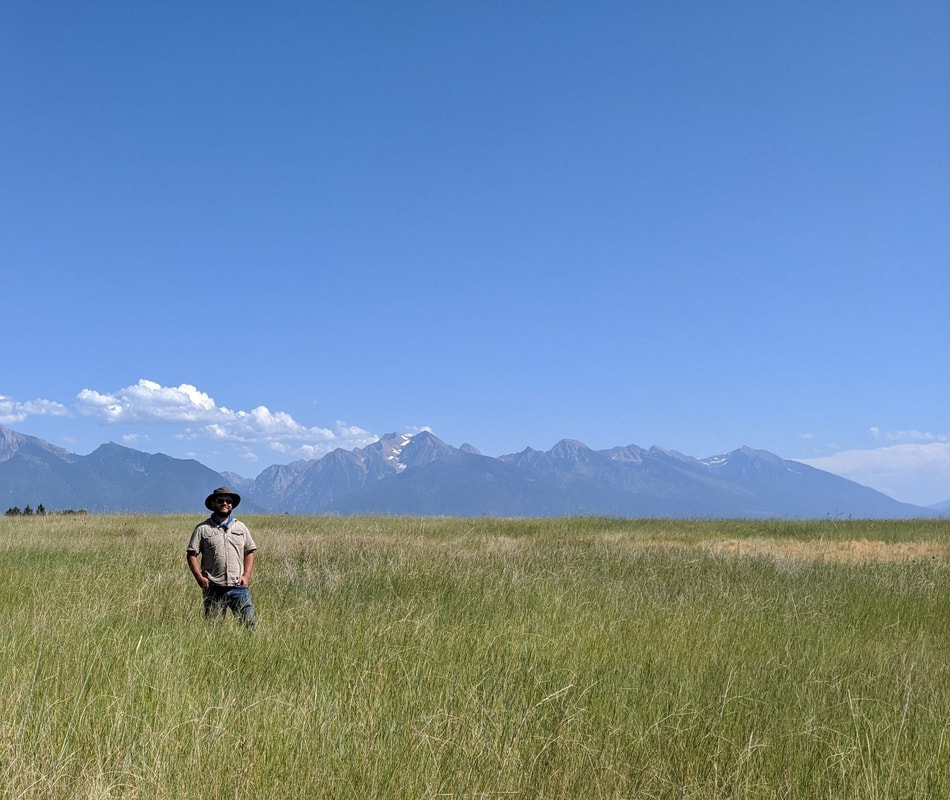 Taking a break to admire the Mission Mountain Range. As part of the Carbonate Critical Zone Research Coordination Network 2020 Virtual Workshop, I helped put together a virtual field trip video of karst springs in the Nittany Valley, Central Pennsylvania. Back when this workshop was planned to be in-person there was going to be a field trip to this area to see these springs. As the workshop went virtual, my PhD PI Dr. Laura Toran and I decided to put together a virtual field trip to try and give everyone at least some of the experience! As part of the video we also interviewed Dr. William B. White, Emeritus Faculty from Penn State, to narrate the video. Enjoy! During fieldwork last week up in the Flathead Valley along the Swan Range I brought my new drone (a DJI Mavic Mini) to record some footage of the field area. Our main goal during this trip was to begin measuring meltwater runoff and stream flows to develop our water budget for the valley to construct a groundwater model and assess future water use scenarios. The last chapter of my PhD dissertation has been accepted for publication in the journal Groundwater. Cheers! The Montana Bureau of Mines and Geology recently celebrated its 100th anniversary. As part of this we held a Centennial Celebration with a variety of demonstrations and exhibits in the Bureau building for the public to stop by and enjoy. The exhibit I helped set up was called the Water Bar, in which we brought in about a dozen drinking water samples from around Montana which visitors could try out for themselves. 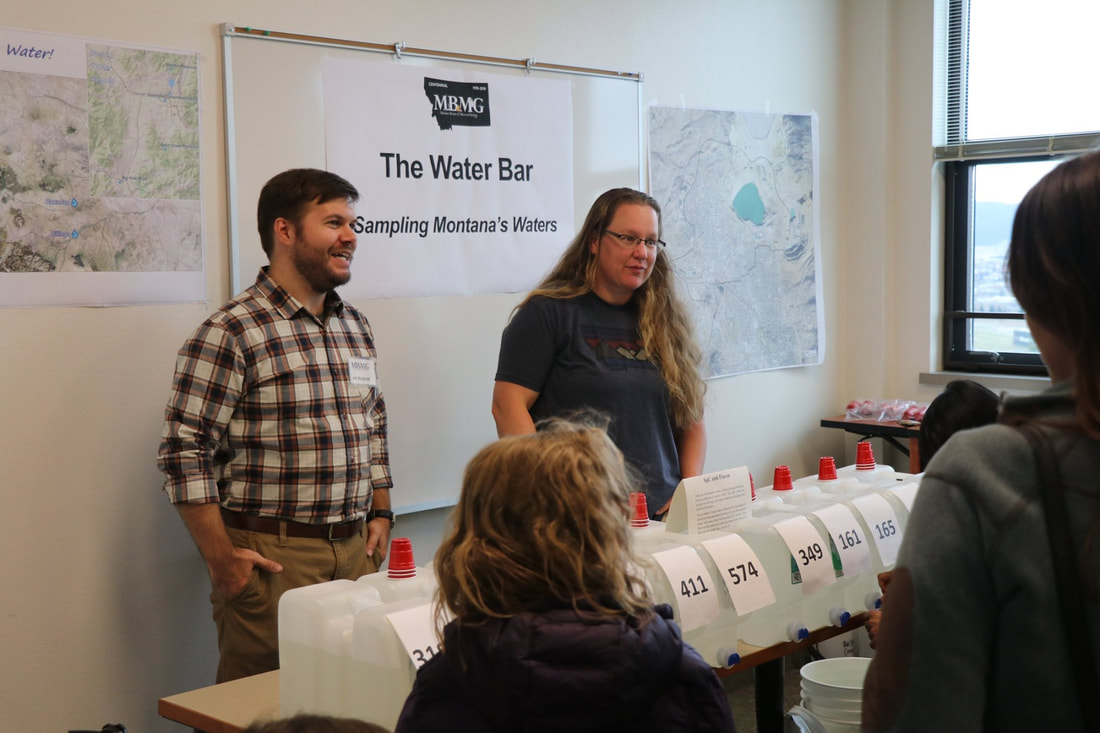 The numbers on the jugs were the specific conductance (SpC) values we measured beforehand; basically, a rough indication of the amount of total dissolved solids (TDS) in the water. As this has an effect on taste, visitors were able to see directly how high or low TDS affected taste for them, and which they preferred. After trying the different waters, they could flip over the labels to see where the water was from, along with a cartoonized summary of the geology. Visitors voted on their favorite tasting water and the winner was Butte groundwater from the Groundwater Control Area! 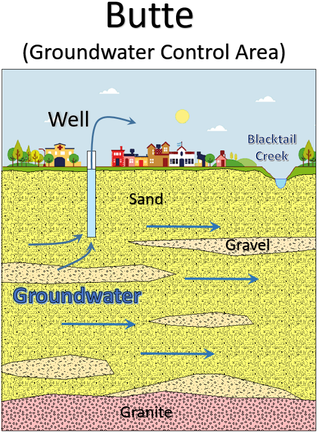 Around the same time I also attended the Montana chapter of the American Water Resources Association (AWRA) held in Red Lodge, Montana. A blizzard hit the region a few days before so there were some travel difficulties, but we made it! Most of the MBMG department attended the conference. 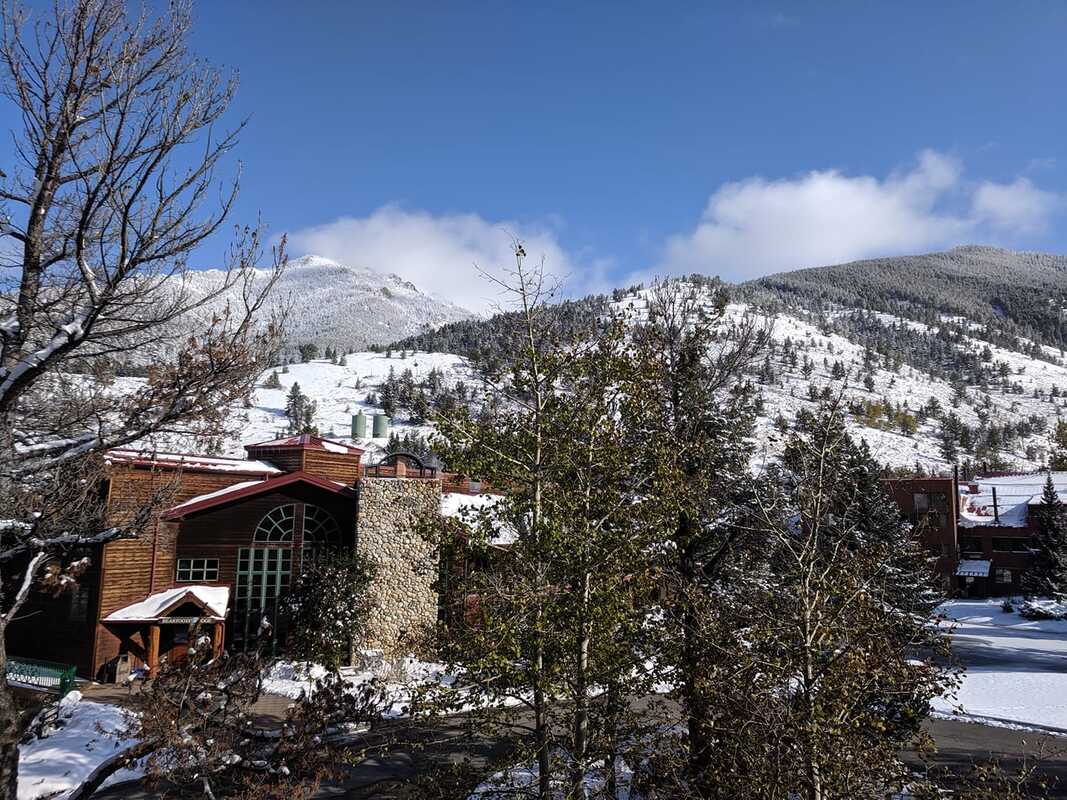 At the conference I presented on some of my findings from Temple University on conduit flow modeling using FEFLOW. My finished poster was larger (obviously). 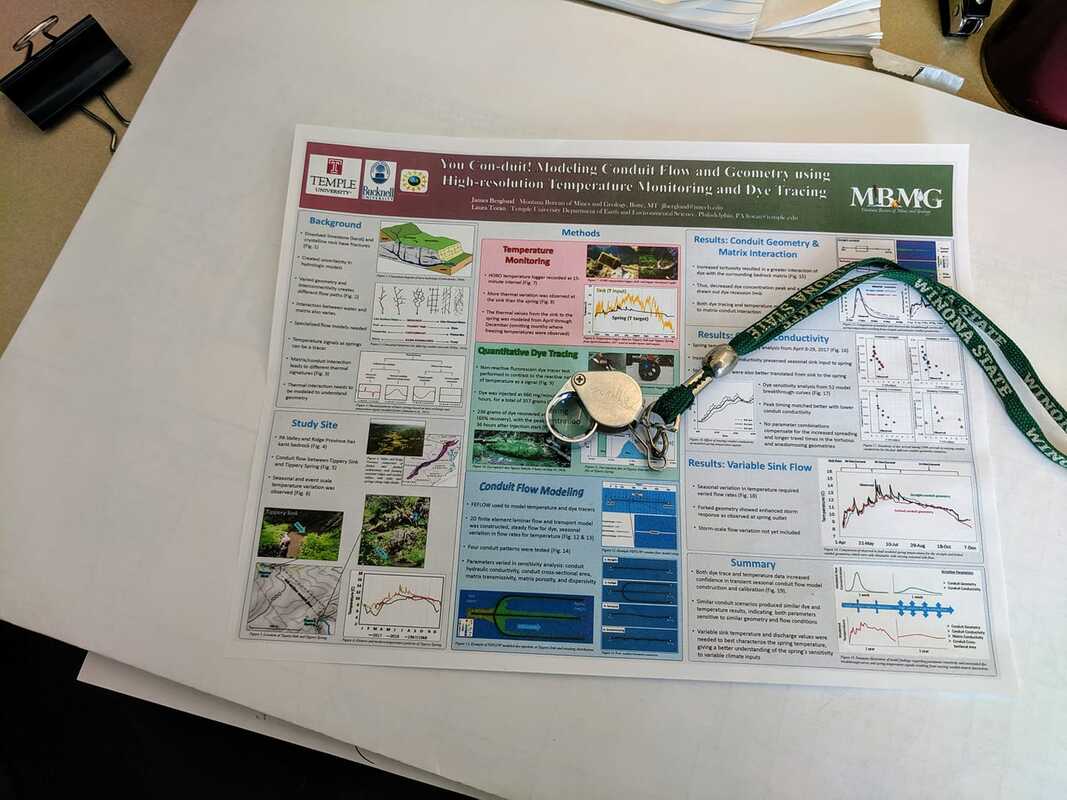 Last week I was up in the Swan Mountain Range surveying some sites to set up stream flow gauges for a groundwater model. 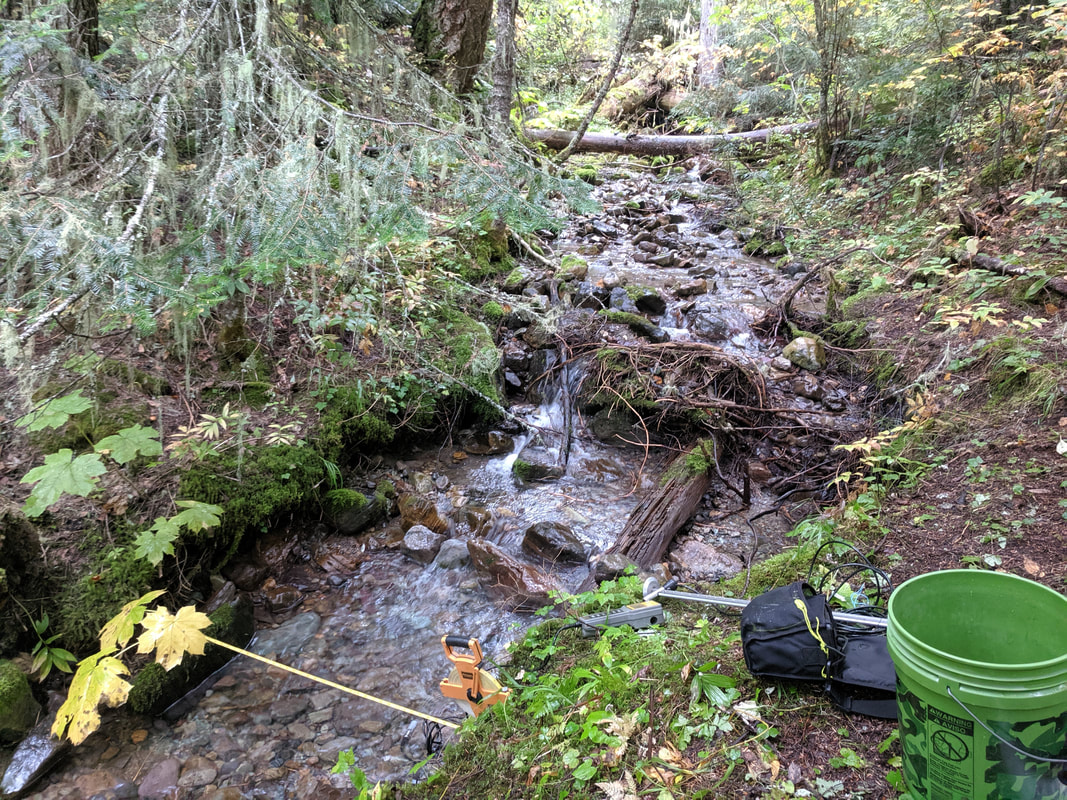 At one point while up around 4,400 feet above sea level, I looked over and saw a particularly interesting boulder. Most people might just look at it and say "oh neat, it's kind of wavy," but if you're a geologist you'd likely see it and freak out a little bit (as did I). 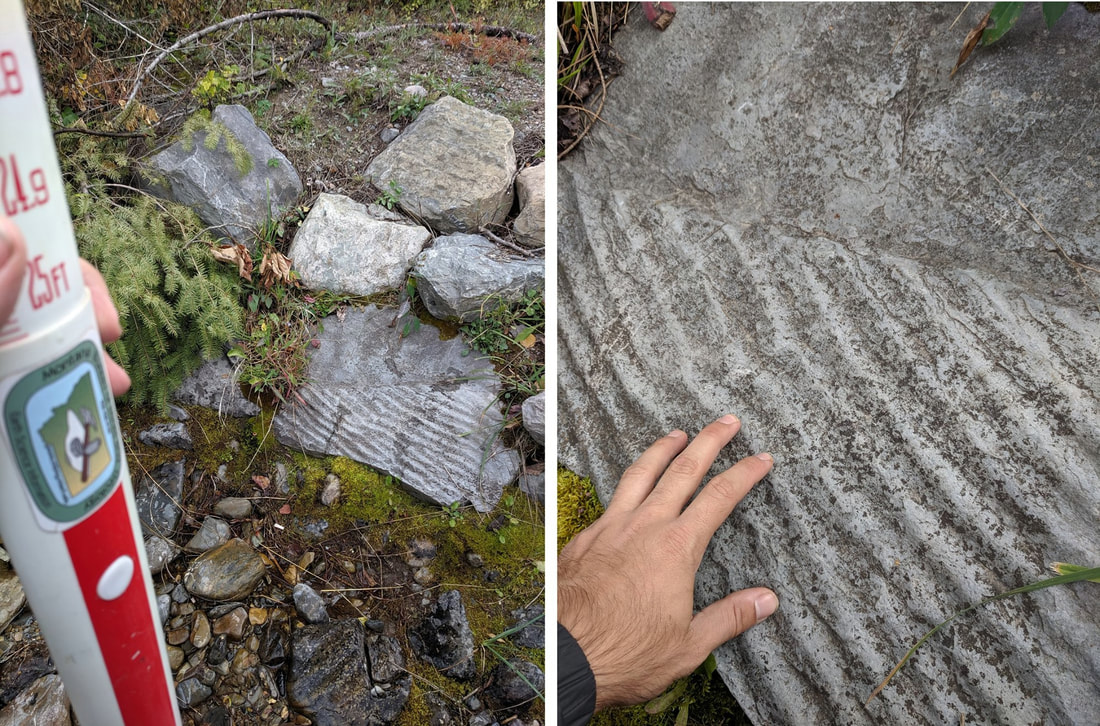 Those little waves are ripple marks preserved in this particular boulder due to moving water. "Well yes, you're near a river, that makes sense" you might say, except those ripples weren't created after the rock was formed, they were created BEFORE the rock was formed, when it was still sediment. For this particular rock, that was about 1.4 billion years ago, or 1400 million years ago, part of the Belt Supergroup of rocks. Because geologic time is always difficult to wrap your mind around: humans evolved 2 million years ago, dinosaurs went extinct 65 million years ago, Pangea broke up 175 million years ago, and the dinosaurs evolved 240 million years ago. When these ripples formed, life on Earth was "just" starting to evolve beyond bacteria. On top of that, there are details about the ripples that tell us more about what was going where it formed. The shape of the ripples let's us know whether they formed in water that was flowing in a single direction (like a river) or swashed back and forth in two directions (like waves on a beach). These ripples are symmetrical in shape, so they indicate two directions of water movement, such as a beach along the sea. You might say, "But you're on a mountain in Montana, nearly a mile above sea level, there are no seas near you," and you are correct - but a lot can happen in 1.4 billion years. In this case, a lot of uplift and mountain building. Finding something like this is always kind of a trip for geologists because it's like stepping into a time machine. While on the day I found this rock I was nearly a mile above sea level next to a tiny stream and only a little above freezing, 1400 million years ago on this spot I would have been on a beach next to the ocean, which would have made for a nice fieldwork day! 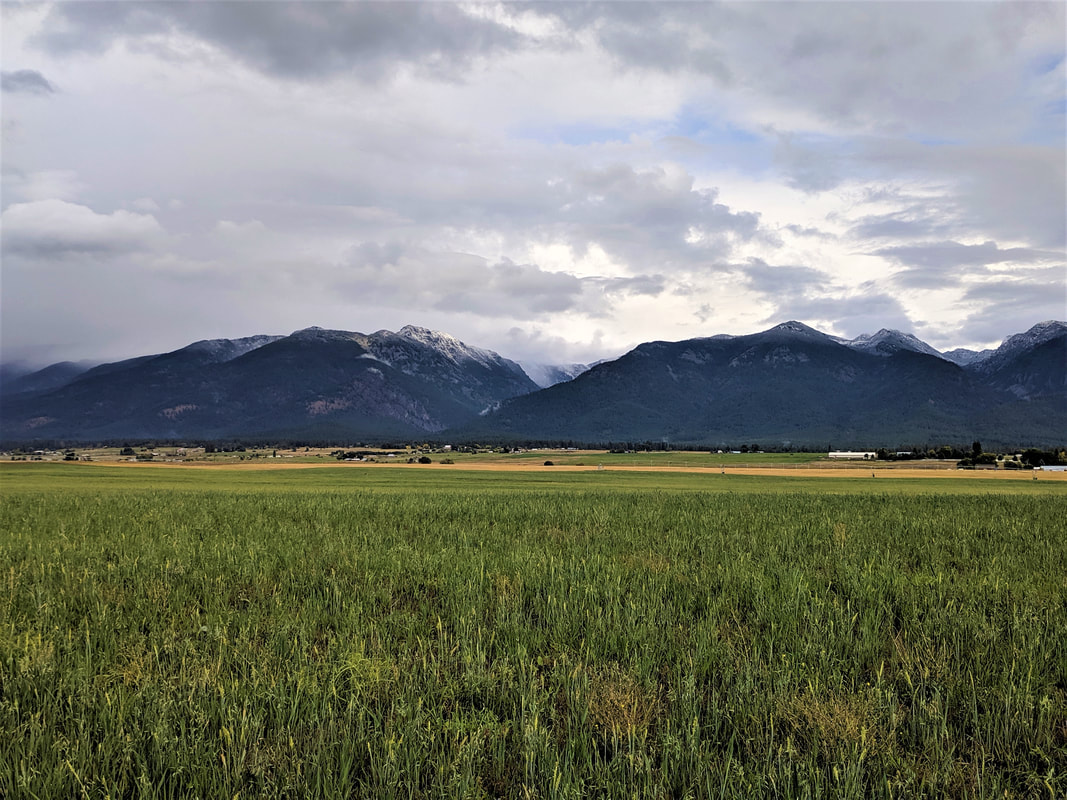 |
 RSS Feed
